Crop insurance and drought
The U.S. Department of Agriculture’s Risk Management Agency (RMA) makes subsidized insurance available to protect farmers’ and ranchers’ income from weather and other risks. It is a complex undertaking, balancing direct and indirect objectives, including:
- Protecting farm and ranch income
- Balancing market forces favoring greater production with the need to protect natural resources, such as groundwater, favoring less intensive cultivation
- Equitably distributing risk protection across different environments, crops, regions and producer groups
Working with the USDA’s regional Climate Hubs, the National Drought Mitigation Center at the University of Nebraska-Lincoln undertook an analysis of crop insurance and drought, to see whether there are “hot spots,” with a high frequency of drought-related claims, or “cold spots,” areas where insurance may not sufficiently protect against drought.
Inviting interpretation
This has so far been a top-down, data-driven analysis. The 20,000-plus maps generated so far may help detect areas where drought insurance is used intensively or where it could be used more, and they raise some interesting questions. But climate, crops and insurance practices vary across the country. As a next stage in this process, the NDMC is asking experts and advocates to take a look, including RMA and Farm Service Agency experts, producer organizations, and advocates for sustainable (regenerative) agriculture. The maps are a tool for detecting patterns, but interpreting patterns requires knowledge of crops, insurance and producers’ decision-making. Likewise, identifying hot spots and cold spots of drought-related crop insurance use, with the implication that some may be benefiting more than others, is a larger policy discussion.
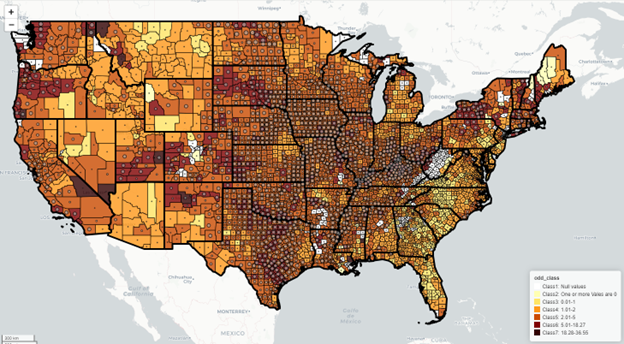 This map combining data for all crops shows the odds of a county having at least one drought-related claim in a month when there is drought.
We used the RMA’s monthly “Cause of Loss” data to identify counties with one or more drought-related claims for a given crop and year, and we used the U.S. Drought Monitor (USDM) as an objective assessment of drought conditions. The USDM is not part of the RMA’s claims assessment process. The analysis is based on data since 2000, as that marks the beginning of USDM data as well as more comparable RMA data.
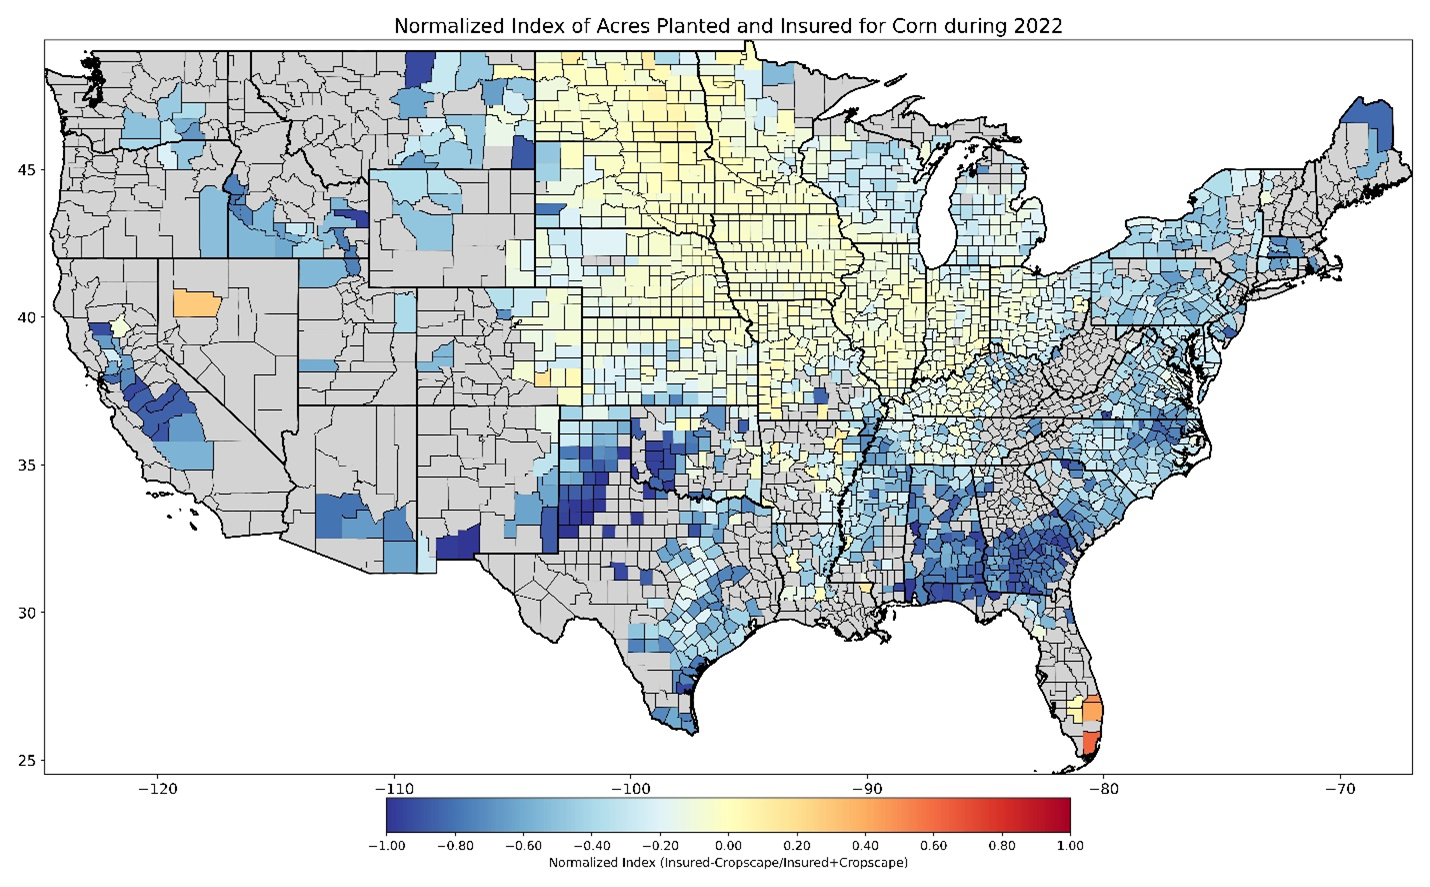 This map uses a normalized index to compare acres of corn planted and acres of corn insured in 2022. Blue areas indicate places where crops are less likely to be insured.
As an additional way to look for “cold spots,” the NDMC compared where crops were planted, based on CropScape data, with where crops were insured, based on RMA’s annual Summary of Business data.